
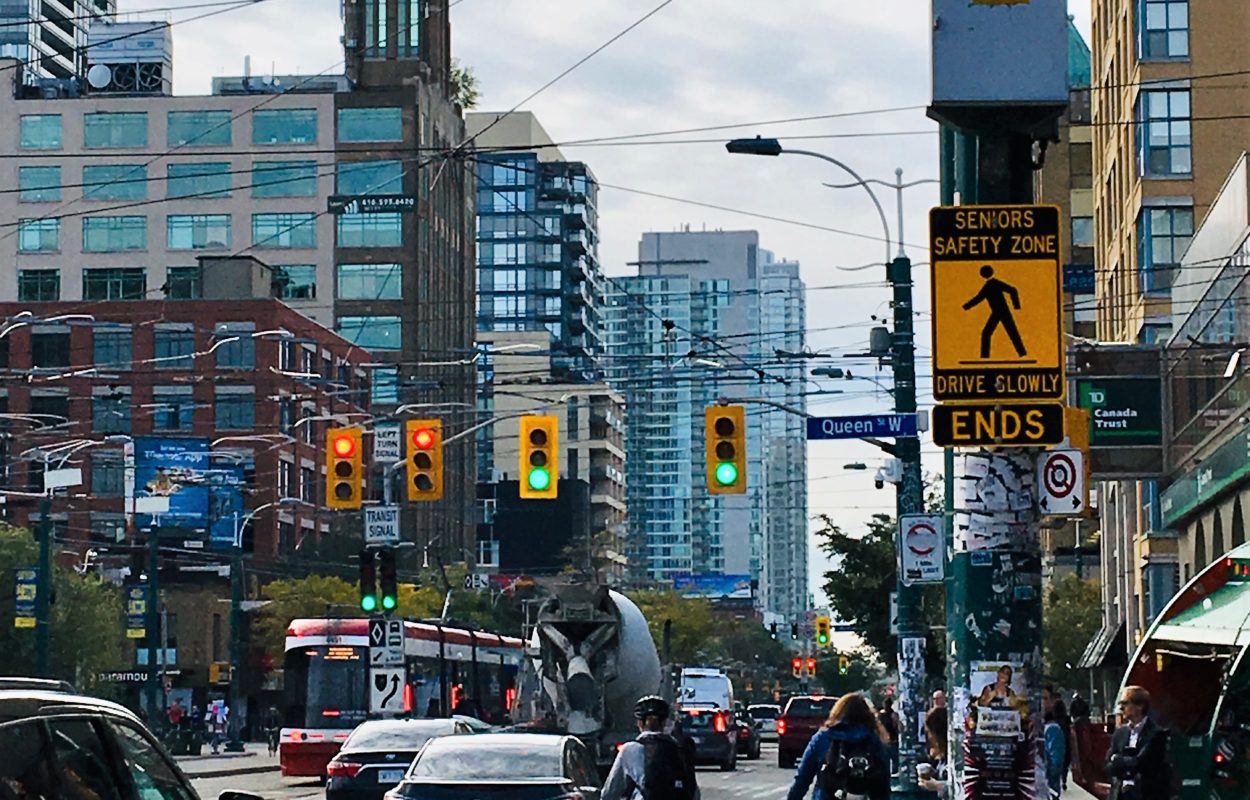
A lot of new signs have gone up in Toronto recently. As part of Toronto’s Vision Zero Road Safety Plan, signs were added to 12 locations in 2017, to designate them as “Senior Safety Zones”. These areas also included Watch Your Speed displays, increased pedestrian walk times and enhanced pavement markings. A further 53 locations were added in 2018.
In 39 priority corridors where a high number of pedestrians have been killed or seriously injured, an amazing 837 new signs have gone up to reduce speed limits by 10km/hr, again alongside speed education, signal re-timing and enhanced pavement markings.
In June 2018, Council voted to expand the Vision Zero Road Safety Plan and designate school safety zones around every elementary school in Toronto. This means signs will go up at every school, designating it a safety zone and lowering the speed limit. Other potential measures include improved street lighting, leading pedestrian intervals, mid-block crossings, increased enforcement, improved pavement markings, flashing signage and/or public awareness campaigns.
With all this recent enthusiasm for signs (and pavement markings!), it’s good to take a moment consider what signs can do for us. Given our goal of zero deaths on Toronto’s streets, are we asking too much of simple painted metal sheets, stuck on a pole in the ground?
I saw the sign – or did I?
It’s easy to put up signs. But they are only effective if the laws and regulations that they are communicating are good, if the road environment supports the intended behaviour, and most of all, if people see, understand, and follow them. A study in Sweden found that the probability of a driver noticing a sign at high speed is not higher than 50%.
Once a sign is seen, it must be correctly interpreted. Many signs in support of speed reduction campaigns in particular are poorly designed. Carefully choosing elements such as size, font, placement and reflectivity can improve effectiveness, but the desired outcome is far from guaranteed.
The driver must still comply with the sign, and if the road environment is not built to match a desired behaviour, such as a reduction in speed, the likelihood is very high that the sign will be ignored. Several studies have found while school zone signs did result in an average reduction in speed of 10km/hr, an alarming number of drivers were still driving above the speed limit – over 80% of them in one study. Another study found school zones had no discernible effect on drivers at all.
Looking Past the Sign
With the outcome of signage so dependent upon driver notice, interpretation and compliance, a lot of uncertainty exists. As a result, the road safety benefits are generally modest, often consisting of speeds a few kilometres per hour slower (see the table below for some examples).
To meaningfully reduce speeds and collisions, signs should be paired with interventions that change the physical road space. A narrower travel lane encourages driver caution, a speed hump requires drivers to slow down or risk damage to their vehicles, a roundabout makes drivers reduce their speed through an intersection and reduces the possible points of conflict from 21 to eight. Rather than relying on a sign alone, these changes make the desired behaviour feel like the natural behaviour.
A closer alignment between desired speed and roadway design means that lower speeds are more likely to be followed, and as a result, these interventions have greater success in reducing collisions. The B.C. Community Road Safety Toolkit cites crash reduction factors of between 25 and 50% for physical road interventions, such as gateways, speed humps, medians, roundabouts, and area-wide traffic calming (see the table below).
Gateways are good illustration of the difference between signage and physical traffic calming. Typically, they are used in areas where a road transitions to a lower speed, as when a country highway enters a town. They can consist of a large sign (“Welcome to Our Town!”), decorative plantings, an archway, pavement markings and a reduced speed limit. They can also include physical modifications to the road space, such as street narrowing, a median, speed humps, or curb extensions. A gateway with no physical changes will only result in a 3% reduction in speed, whereas one that includes both signage and road modifications can produce a 27% reduction in speed and a 25 – 50% reduction in crashes.
Physical interventions are more expensive than signs and pavement markings. They require more political will, and they can face opposition. By slowing traffic down, they are, after all, doing precisely the opposite of what roads have been designed to achieve for the past fifty years. But if we have the will, the motivation and the commitment to do more than put up signs, to actually make significant changes to our streets, we will also see a significant increase in safety. In fact, in some places, the safest streets have no signs at all.
Sign-Based Interventions
| Intervention | Effectiveness at Reducing Speed | Effectiveness at Reducing Collisions |
|---|---|---|
| Watch your speed: Signs with an electronic display that show drivers their current speed | Varies from small to significant, depending on location of sign. Work best in areas with transitions to low speeds. One study found 5 to 14km/hr speed reductions in a school zone. May lose effectiveness over time (B.C. Community Road Safety Toolkit). | 5 to 7% reduction in crashes (B.C. Community Road Safety Toolkit). |
| School safety zones: Areas near schools designated by signs with reduced speed limits | 10km/hr reduction in speed, but over three quarters of drivers still non-compliant (Lazic, 2003; Strawderman, 2015). Other studies have found no effect on vehicle speed (Young and Dixon, 2003) | |
| Gateways: Used to mark a transition to a lower speed, often at the entrance to a town (signs and pavement markings only) | 3% reduction in speed (B.C. Community Road Safety Toolkit). | |
| Pavement markings at crosswalks | 2-5 km/hr reduction in speed, or 7% (Guo, 2016) | 25% reduction in pedestrian-vehicle crashes (Guo, 2016) |
| Share the road with cyclists signs | 4 km/hr reduction in speed (Kay et al, 2014) |
Physical Interventions
| Interventions | Effectiveness at Reducing Speed | Effectiveness at Reducing Collisions |
|---|---|---|
| Gateways: Used to mark a transition to a lower speed, often at the entrance to a town (signs, pavement markings, and physical features such as street narrowing, median, speed humps, curb extensions etc) | 27% reduction in speed (B.C. Community Road Safety Toolkit) | 25 - 50% reduction in crashes (B.C. Community Road Safety Toolkit) |
| Speed humps: Raised protrusions placed across the road in the path of motor vehicles, typically 7.5 to 10.0cm high and 3.7 to 4.3m wide. Different from speed bumps, which are generally higher and shorter. | 22% reduction in speed, or 12km/hr on average. Average speed post installation is 44km/hr (Ewing, 2001) | 50% reduction in crashes (B.C. Community Road Safety Toolkit). |
| Curb extensions, chicanes, median islands or lane narrowings: Traffic calming interventions that rely on modifying the road horizontally (as opposed to speed humps, which are a vertical change) | 6% reduction in speeds for chicanes 13 to 20km/h reduction in speed for narrowing lanes (B.C. Community Road Safety Toolkit). | Median: 39% reduction in crashes on urban two-lane roads (B.C. Community Road Safety Toolkit). |
| Roundabout: A circular intersection design where road users yield to other traffic, rather than turn-taking governed by stop lights | 11% reduction in speed. Average speed post ins tallation is 52km/hr (National Collaborating Centre for Healthy Public Policy, 2011) | 38% reduction in collisions. The number of potential conflicts points is reduced from 21 in a traditional intersection to just 8 (National Collaborating Centre for Healthy Public Policy, 2011) |
| Area-wide: 20mph (32km/hr) zones marked by signage and traffic calming (speed humps, raised intersections, chicanes) | 42% reduction in collisions 48% reduction in collisions involving children (National Collaborating Centre for Healthy Public Policy, 2011) |